Blog
Herding in the most volatile market in decades
Dec 05, 2018In finance and economics, there is a branch called behavioural finance, which tries to theorize, research, and document the human emotional aspect and behaviour of financial participants. Behavioural finance suggests psychologically based theories to try to explain deviations in price.
One of the most powerful techniques used in an economist’s arsenal in understanding the behaviour in markets is trying to find herding behaviour in a certain type of financial market or market index. Usually using mathematical models such as CSSD (cross-sectional standard deviation), HIX (Herding index), VAR models, etc. These mathematical techniques are used to find herding behaviour.
What is Herding Behavior?
Herding Behaviour is a phenomenon that occurs when individuals try to mimic the trades of others and thus traders copy each other. Two of the most important aspects is price and volume, especially the direction of causality between them.
Think of it like the bandwagon effect in economics. Which is a term that is used by economists to explain certain psychological actions that people take in their everyday life. The bandwagon effect occurs when an individual does something just because everyone else is doing it. For our purposes, people will buy into something just because other people are buying into it and thus we would observe the price rising.
In order to find this type of effect or in other words to find herding behaviour, one would need to analyse the effects between price and volume, and the direction of causality between them.
The importance of finding herding in a financial market is to know whether the current price of an asset is causing an increase in transactions and thus volume or is an increase in transactions causing movement in price.
If one is to find herding in a financial market that would mean that price causes the movement in volume and thus market participants are not doing their own due diligence and are favouring to make trades based upon the movement in price.
This would suggest that market participants are not doing their homework when it comes to analysing the market. They are only buying when the price goes up and selling when it goes down.
However, if one is to find that no herding is present in a financial market then this would mean that volume causes price to move, and thus market participants are doing their due diligence analysis and only then committing to a transaction which would increase volume and thus the price would either increase or decrease.
In this case the market is not psychologically based and does not care what the price is because there seems to a method to its madness, a trader would look to use more due diligent approaches such as fundamental analysis in his/her investment decisions, if this is the case.
It should be noted that when finding herding in a financial market, this does not mean that fundamental analysis does not work. It just suggests that the majority of the time the market does not seem to look at fundamentals and other adequate forms of analysis, it seems to react to changes in price mostly. It does not mean that fundamentals cannot affect price in anyway.
Correlation Analysis and You
To do a simple correlation analysis between price and volume is not enough. Even though it is useful to know, a simple correlation between price and volume is 0.66, this means that both price and volume follow each other especially over a longer term, but this does not explain which one causes the other. The graph below shows a scatter plot of the volume and closing price of bitcoin, with volume being scaled down by a factor of one hundred thousand, in order for the data to fit into the chart.
Using other mathematical processes, we can find the direction of causality between variables. We find that the volume of bitcoin does not cause deviations in the price of bitcoin with any statistical significance. However, we also find that the price of bitcoin does not cause deviations in the volume of bitcoin. This is a weird scenario of price not causing volume and volume not causing price. This would mean that using volume analysis only in your trading would not necessary provide any advantage in the predicting of price in the bitcoin market.
But to analyse the deeper meaning of this phenomenon. How is it possible that volume cannot cause price or even price cannot cause volume? This would mean that the bitcoin market is dependent on other factors possibly news events, costs of mining and other factors.
Volume and Price
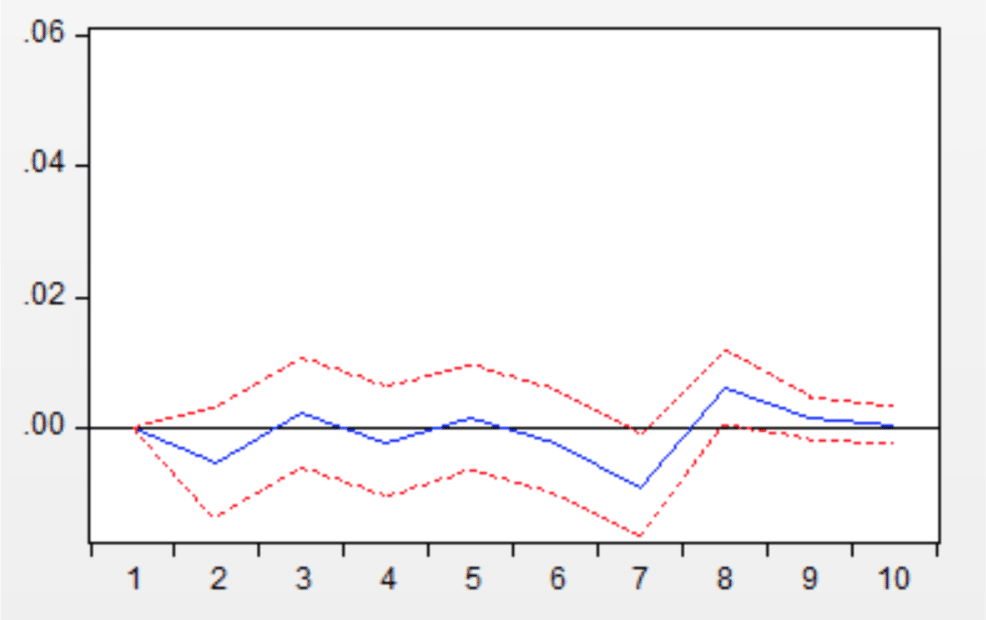
The chart below is a chart showing how an impulse in volume affects the closing price. As can be seen, the volume of bitcoin will not significantly affect its closing price, because the graph remains relatively stable.

From this analysis we can conclude that in the bitcoin market, only using volume will not help in trying to predict the price of bitcoin, more specifically depending on volume alone to predict the closing price of the next day is futile. This does not mean that volume cannot predict the longer term trend, it only means that day trading in this type of market is futile when using volume analysis only. More analysis is to be done in addition to volume analysis when making trading decisions on whether to buy or sell.

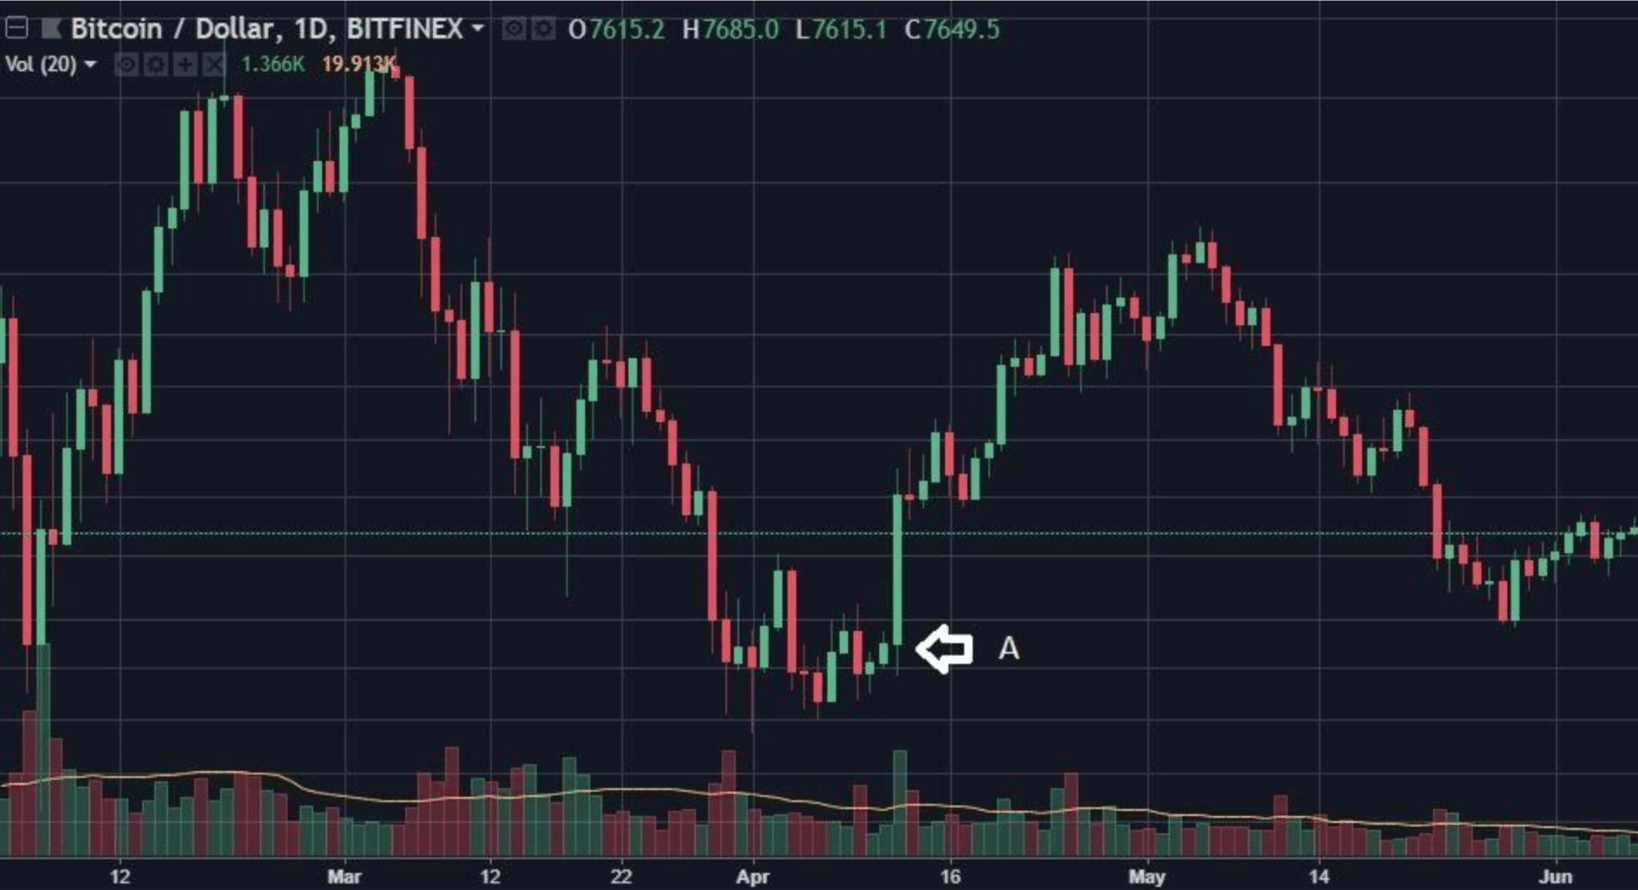
We give an example here to demonstrate. Looking at the long green bar marked by point A with its increased volume, looking at this a day trader would expect a follow through in the next candle, for its close to be higher than its current open. However, this is not the case the closing price remains flat, closing near its open price, just as we predicted.
This is as a result of volume not causing price and price not causing volume, thus we cannot expect a follow through in the next day. However, the medium-term trend was bullish, this is as a result of a high positive correlation as discussed above between price and volume.
Using this analysis, we can expect that when we have above average volume in one direction in this market we can expect a follow-through in the long run but not a short-term continuation.
Final Thoughts
Being aware of the above gives us an advantage because we can enter into a long position at the open of the next day’s candle of point A and our holding period would be longer than a day, possibly a week to a month. In this instance day traders should not trade due to uncertainty, rather they should hold on to a longer-term trend.
By Alex Moskov


